01 / THE STUDYREGIONAL EVIDENCE · SPATIAL PATTERNS
EUROPEAN REGIONAL ANALYSIS
Crime patterns sit within wider regional conditions.
2022 DATA · NUTS 2 REGIONS · EUROSTAT
Beyond the Map compares regional measures of population, tertiary education, household income and unemployment with police-recorded robbery and burglary. The team first maps how each measure varies, then uses spatial statistics to examine whether similar or contrasting values appear in neighboring regions.
What the study examines
The unit of analysis is the European NUTS 2 region. The presentation combines five-quantile maps, global Moran’s I tests and local cluster maps, followed by bivariate spatial comparisons.
01 / SOCIAL
Population
Regional size and concentration provide context for recorded event counts.
02 / EDUCATION
Tertiary attainment
Share of residents with a tertiary level of education.
03 / ECONOMY
Income & work
Household income and unemployment indicators.
04 / OFFENCES
Robbery & burglary
Police-recorded offences mapped by region.
RESULTS REPORTED IN THE SOURCE REPORT
Small positive spatial patterns
The report gives global Moran’s I values for several 2022 regional measures. The unemployment measure has the largest value among these results, while the other statistics are closer to zero.
The reported p-values come from 999 permutations. Statistical significance describes evidence of spatial pattern under the reported test; it does not show a large practical effect or a cause of crime.
THE POWERPOINT · INSIDE THE PAGE
Browse the full presentation.
Use the larger blue controls or your keyboard arrows to move through the deck. The note below the frame summarizes each slide.
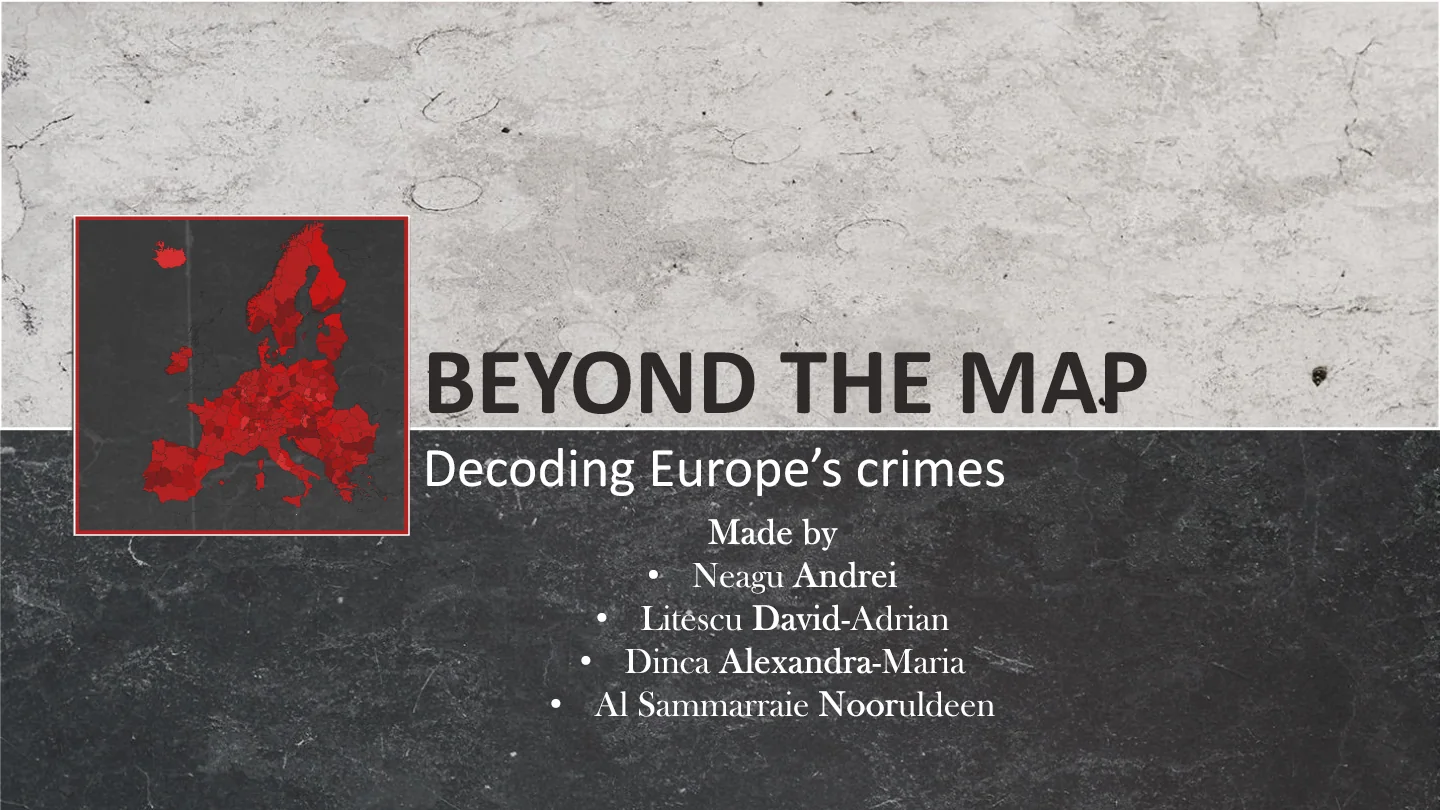
BEYOND THE MAP / EUROPEAN REGIONS01 / 16
01 / COVER
Decoding Europe’s crimes
A collaborative student project on regional socioeconomic measures and recorded theft-related offences.
Global Moran’s I tests whether values show spatial autocorrelation overall. Local indicators of spatial association (LISA) identify regions whose values resemble or differ from nearby regions. The report gives small positive global statistics and describes high-high, low-low and contrasting local clusters.
These tests describe geography in the selected indicators. They do not show that education, income or unemployment causes a particular offence.
Why population and offence definitions matter
The presentation maps recorded counts for robbery and burglary, not offences per resident or every kind of theft. Larger or denser regions may have more incidents because more people and potential targets are present. Reporting and police-recording practices can also differ between regions.
Comparing rates with consistent population denominators, offence definitions and regional coverage would help separate these differences. The report discusses additional theft and social indicators that are not part of the presentation’s main maps.