A starting point
Understanding Iraq’s economy in the years after 2003.
 Al Sammarraie
01 IRAQ ECONOMIC OBSERVATORY
Iraq’s Economic Outlook: Building an Economic Analysis System with Iraq as a Case Study
I grew up in Iraq, and I want to understand how its oil wealth relates to pressure on public finances and the difficulty of building a more diverse economy. This is the Python application and research I am developing for my bachelor's thesis at ASE.
Economic Informatics · ASE Bucharest
My intended defence: July 2027
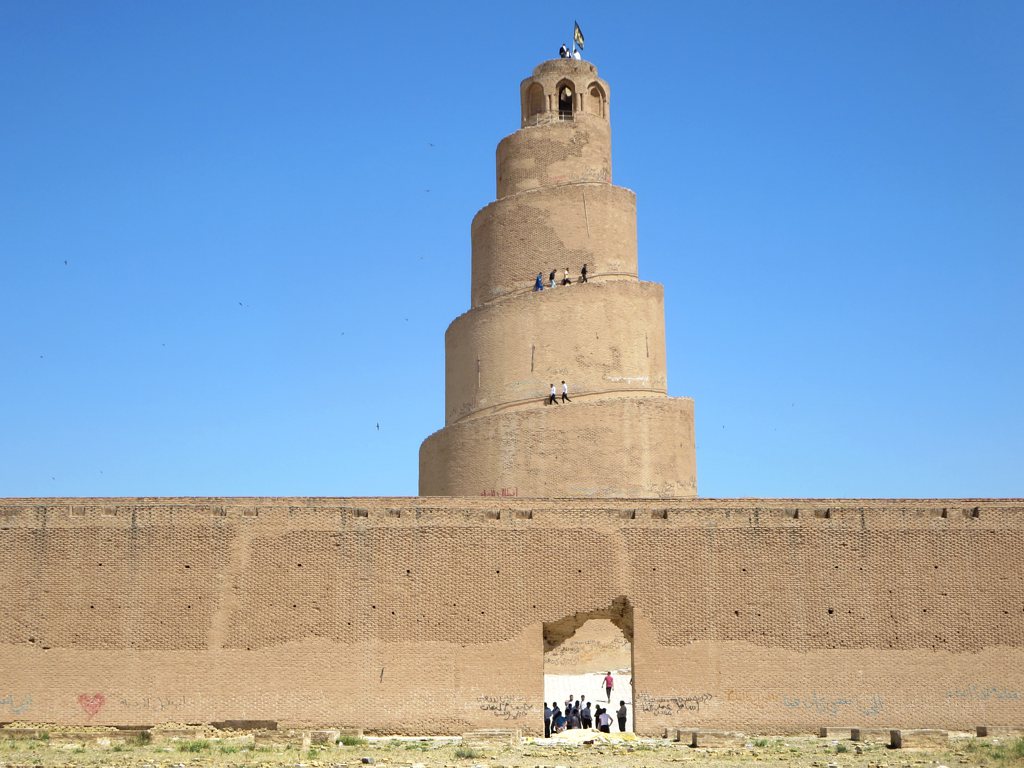
Understanding Iraq’s economy in the years after 2003.
Reading the evidence, following the sources and asking better questions.
Bringing data, methods and an interactive application together.
Exploring forecasts, uncertainty and clearly stated scenarios.
2003 marks the US-led invasion and the fall of Saddam Hussein's regime. I chose this as the starting point for understanding Iraq's economy in the period that followed.
Growth, real income per person and manufacturing run through 2025. Oil rents keep their available 2003–2021 window.
World Bank WDI ↗The continuous model uses 2016–June 2026. I preserve cumulative accounts, derive monthly increments and keep the earlier archive separate for review.
CBI statistical bulletins ↗The IMF April 2026 projections through 2031 provide a separate baseline for sensitivity calculations.
IMF World Economic Outlook ↗January 2016–June 2026 in the continuous fiscal sample used by the saved monthly experiment.
A mixed catalogue of source tables and series with different periods, definitions and units. The count is not a combined dataset.
Earlier CBI records remain candidates for source review. They are kept outside the accepted model sample and are not used to extend it.
The national picture, with the date and source kept beside every number.
Loading the saved research preview…
IRAQ / NATIONAL INDICATORS
World Bank WDI · saved October 2026. Published national series can include estimates. Each card uses its own latest available year.
What interests me is how Iraq has developed after the US-led invasion in 2003 and the fall of Saddam Hussein's regime. I want to understand why having valuable oil resources has not made development straightforward, look at the evidence carefully, and build a tool that helps me explore the questions.
I chose 2003 because it marks the invasion and the fall of Saddam Hussein's regime. I want to follow the economy after that change, using growth, real GDP per person and manufacturing.
I am examining recorded revenue and spending month by month, while keeping oil-related income and accounting adjustments visible.
I compare five methods on the same months and inspect their errors and uncertainty before choosing a final model.
I can change an oil-price or spending assumption and calculate the resulting pressure around a published annual baseline.
I want to understand what the evidence shows. A country comparison can help me spot a pattern, but it cannot prove what caused it.
A quick route into the evidence, saved model results and assumptions I can change.
INTERNATIONAL SOURCE PROJECTIONS
Choose a source release or compare revisions. These are IMF projections, separate from my models and the April scenario baseline.
Solid lines show historical or estimated IMF values; dashed lines show source projections. These are separate from my saved monthly revenue forecasts and user-selected budget scenarios.
Separate from the monthly revenue experiment and the IMF source outlook.
IRAQ ECONOMIC OBSERVATORY
This compact browser preview highlights selected saved results. Open the hosted Python application on its own page to try the public version.
Try the Python applicationOpen the application in its own workspace.
Loading the saved research preview…
I keep the history from 2003 and compare the yearly figures as they were published.
Each point is a published annual observation. Missing years stay missing. Hover or tap a line to inspect the country, year and saved value.
Select country lines to focus on them. Select several to compare, or show only your selection.
These dated events provide context. Their timing does not establish the cause of a change in the chart.
I compare five methods on the same 24 monthly total-revenue increments, from July 2024 to June 2026, in nominal trillion IQD. The models do not forecast the monthly budget balance. A three-month horizon predicts the single third target month, not a three-month sum. MAE is the average size of the errors; RMSE gives bigger mistakes more weight.
The methods share 19 origins in each evaluation stage. Selection uses earlier validation MAE; held-out results are reported separately. Multi-month errors can be dependent. The chart uses a saved June 2026 origin.
WHAT I FOUND SO FAR AR(1) has the lowest MAE. ARIMA(1,1,1) has the lowest RMSE. I still need to check the model assumptions and remaining patterns in the errors before making my final choice.
The saved origin ends in June 2026; it is not a fresh forecast. Shaded ranges are conditional model intervals. Simple benchmarks have no supplied intervals, which does not mean zero uncertainty.
| Method | MAE | RMSE | Targets |
|---|---|---|---|
| Last month | 3.155 | 5.222 | 24/24 |
| Same month last year | 3.669 | 5.539 | 24/24 |
| AR(1)LOWEST MAE | 2.815 | 4.551 | 24/24 |
| ARIMA(1,1,1)LOWEST RMSE | 2.956 | 4.418 | 24/24 |
| SARIMA(1,0,0)(0,1,1)[12] | 3.528 | 5.000 | 24/24 |
I use the IMF's April 2026 yearly projections as a starting point. Change the assumptions to see how the budget balance changes.
The sensitive share is an assumption. Price and quantity multiply together; other revenue and spending have separate controls. GDP and the exchange rate remain fixed.
The assumptions describe an accounting scenario, not its likelihood. The balancing threshold solves the same equation; it does not predict a market oil price.
Four completed CBI years, 2022–2025. The 2024 and 2025 totals use December cumulative accounts. These preliminary, revisable figures stay separate from the IMF perimeter and projections.
IMF Article IV 2025, Table 2. Select one level of the hierarchy; parent totals are not additional spending.
I compare countries using their 2003–2007 oil rents, real GDP per person and manufacturing. Change how much each feature matters to see how the ranking changes. My calculation uses log GDP per person to reduce the effect of very large income differences.
Iraq is the reference, with a distance of zero. Every loaded comparison country is listed. The features come from the 2003–2007 period.
The ranking describes similarity within this country set. It does not establish why economies developed differently.
Select the countries you want to compare. The view starts with all twelve.
Each line keeps its original unit. Select a tag or line to focus a country; the legend colors stay consistent between the list and plot.
Each point summarizes the available 2003–2021 annual observations for one country: mean oil rents on the horizontal axis and sample standard deviation of GDP growth on the vertical axis. This descriptive comparison does not identify a cause.
A lower distance means a closer match on these features, among the countries I have loaded. This does not prove why their economies developed differently. I may add Bahrain after checking its data.
This is a small taste of what the full application aims to offer. Use the link above to try the current public version of my Python application.
Informal work, unpaid obligations and measurement methods have different sources and definitions.
I want to be able to follow a value from its source to the result on screen. That means preserving definitions, checking the calculations and making the analysis reproducible.
Source snapshots, units, gaps, fingerprints and cumulative-to-monthly conversion.
Country distances, chronological forecast tests, visible uncertainty and scenario assumptions.
Controls, source-quality views and exportable results that I can demonstrate and improve.
Browse the presentation I prepared for my thesis proposal.
VIEW MY PITCH ↓ 02 / RESEARCHMy question, data, proposed methods and the work I still need to complete.
Read my research plan ↗ 03 / PYTHON APPLICATIONOpen the public application in its full-size workspace.
TRY THE APPLICATION ↗THE POWERPOINT · INSIDE THE PAGE
Use previous and next, or the arrow keys, to browse the slides.
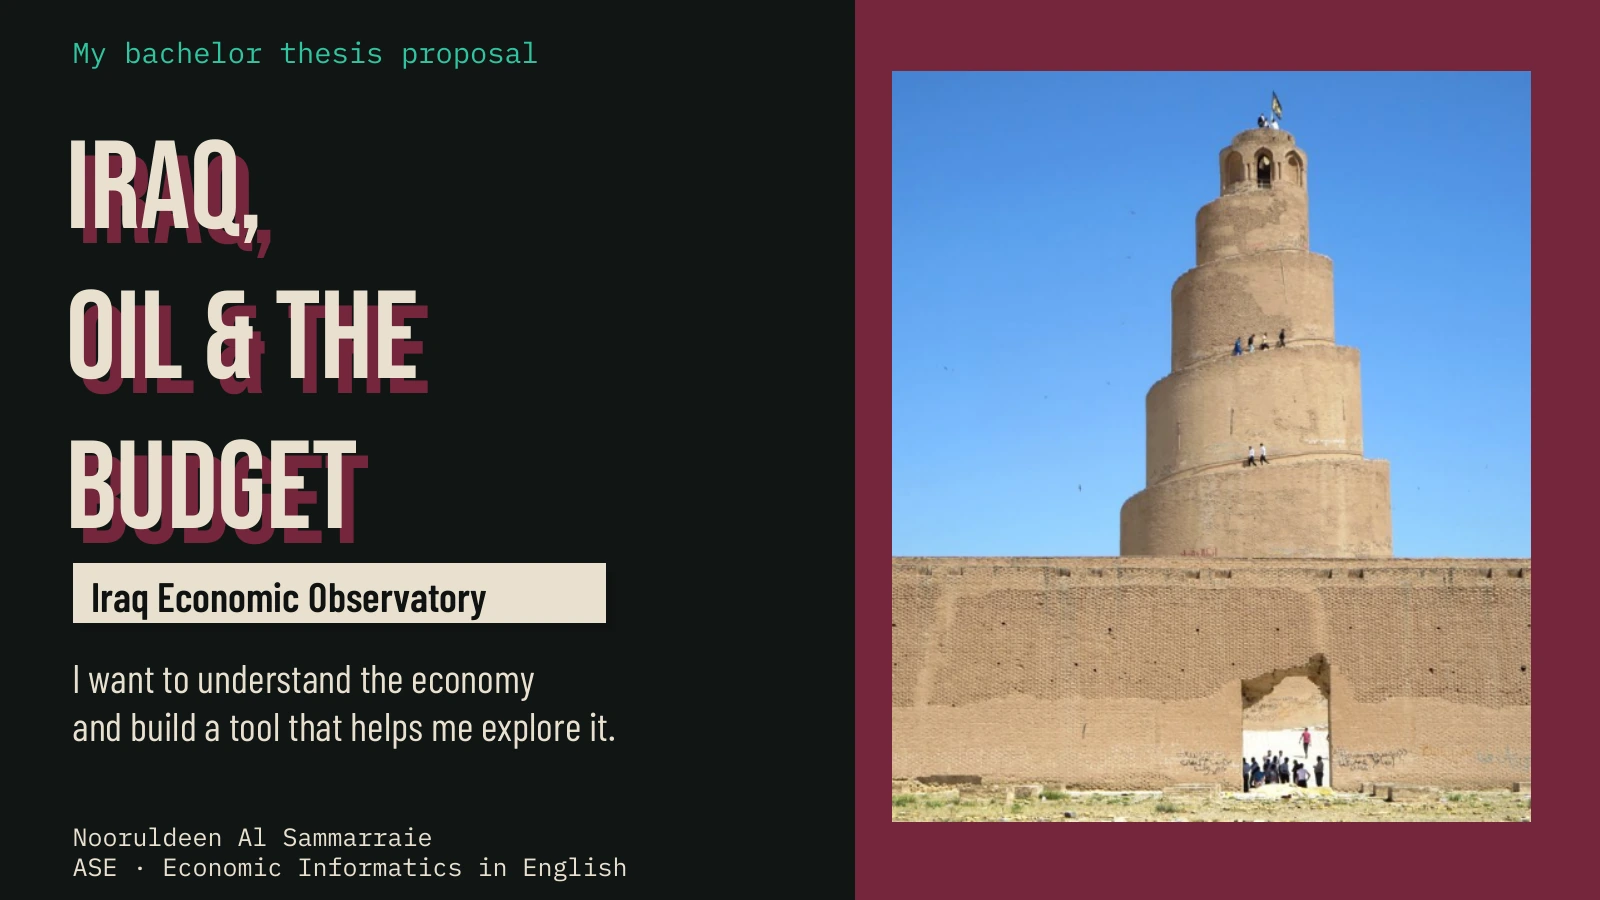
MY THESIS PITCH
My original proposal for a Python application and research into Iraq’s economy.
My thesis title is approved: Iraq’s Economic Outlook: Building an Economic Analysis System with Iraq as a Case Study. Professor Uscatu is coordinating the thesis, and I look forward to refining the work with my professors.
I have organized the program, data, research and writing into one private repository, with this page as a way to share the project as it develops.
After checking the archived CBI tables, I prepared a continuous 126-month fiscal core and tested five forecasting methods on 24 shared targets.
I checked the available datasets before choosing the direction, prepared the annual development history and started the first Python prototype.
Eventually, I want this program to be useful for any country, with a clear way to import different datasets. For now, I am building and testing it around the Iraqi data I understand and care about. Once that works well, I want to make the import process, country choices and analysis easier to adapt. Different datasets will still need their own checks and suitable methods; that wider version is something I want to develop after the core thesis.
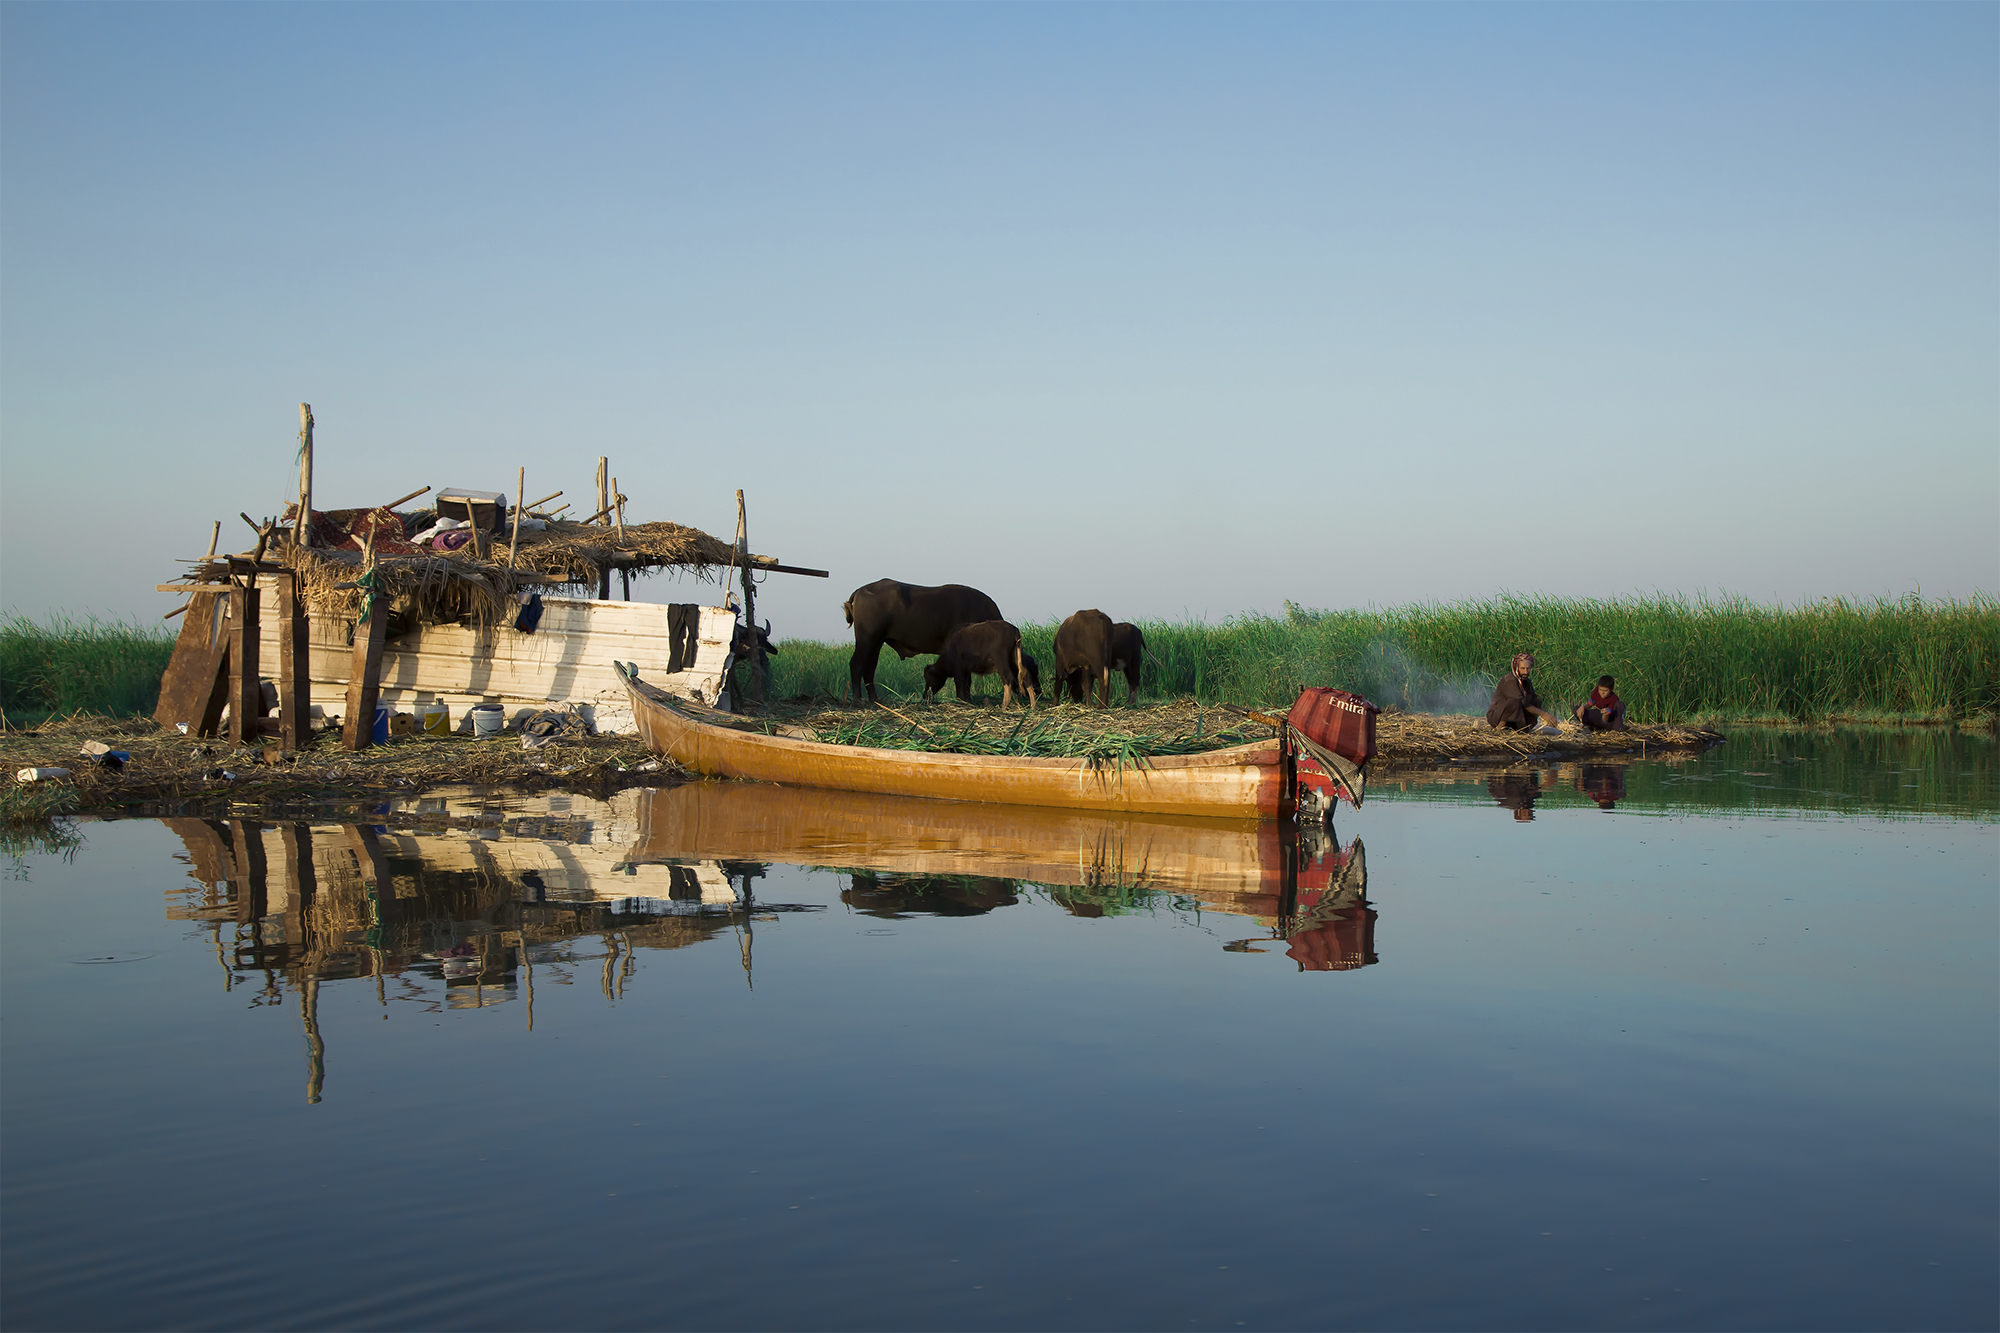
THE REASON I KEEP COMING BACK TO THIS
I want this project to help me ask better questions, become a better programmer and learn statistics I can keep building on.
Talk to me about the project